This page contains examples of prior work in the field of spectroscopy using equipment at the Northwood Ridge Observatory, Phillips Exeter Academy Grainger Observatory and elsewhere. Taking CCD images is interesting and results in some lovely pictures to hang around the house and to show friends, but there is a lot more that an amateur astronomer can do these days. All of the advanced equipment that is now available offers the amateur a whole host of projects to choose from. Spectroscopy is now easily within reach of anyone with a small telescope! The spectra captured at the Northwood Ridge Observatory were done using scopes ranging in size from 106mm to 8″, a Starlight Xpress MX-5c CCD imager, an SBIG ST-7 and a Rainbow Optics transmission grating. Any good CCD imager will do, and it does not need to be a color imager. The CCD camera is also optional. The Rainbow Optics unit is meant to be used at the eyepiece, and anyone can find absorption lines in bright stars using this device. Thus, an amateur can collect spectral data by sketching what is seen at the eyepiece.
To see these images properly, you should adjust your monitor to see the following 17 greyscale steps (solid black to white):

- Altair, Alpha Aql, Type A7 V-IV
- Enif: Type K2Ib Variable Star
- Gamma Gem A0iv
- GSC 3600:183
- M-42: The Orion Nebula
- M57: The Ring Nebula
- NGC 3242: The Ghost of Jupiter
- Quasar 3C 273
- R CMI: Type SEP(CE) Mira-Type Variable
- R CNC Type M6e-M9e Mira-Type Variable
- Regulus B7V
- Sol: Our Sun’s Spectrum
- Variable Star 0749+22C VAR NE
- Vega, Alpha Lyr, SAO 67174, Type A0Vvar
- Z UMa: Red Variable
How to Take Spectra, an Introduction:
CCD imaging has become one of the most influential technologies for amateur astronomers over the past decade. That one single technological advancement has allowed amateurs to get involved with automated supernova hunting, asteroid searching, and now advanced astrophysics via spectroscopy. For years, amateurs have been using home built spectroscopes and spectrographs to see and record the spectra of astronomical objects. Traditionally this has been done visually and with film. Now, since CCD’s have become much more affordable, amateurs can capture spectra quicker and in a more usable format: digital.
In the past decade there have been many versions of visual spectroscopes made available to the amateur market. One such device is the Rainbow Optics Star Spectroscope, a device that consists of a transmission grating housed in a 1.25″ diameter filter cell, and a lens assembly that fits over the telescope eyepiece. Using this device, any amateur can see spectroscopic details in bright stars using modest telescopic equipment. In a 106mm scope, one can make out detailed absorbtion lines in stars down to magnitude 4 pretty easily. Now, place the grating of this unit in front of a CCD camera; Just screw it into the CCD’s nosepiece. You now have a spectrograph capable of recording spectra from any subject that you can normally image. The possibilities are virtually endless.
Setup:
Amazingly enough, the day I received the Rainbow Optics the weather remained clear! This is an unusual event given New England. That same evening I had the grating attached to the back of a 20mm Plossl, the special lens attached to the front of the eyepiece, and was observing dark absorbtion lines in Sirius! Within another 15 minutes, I had the grating attached to the nosepiece of the Starlight Xpress MX-5C color imager and was making headway up the learning curve of amateur spectrography.
The distance the grating resides from the imager chip determines the spread of the spectrum, and to some extent, the resolution offered by the system. Since the nosepiece of the MX-5C is so long, the spectrum fills the width of the CCD image, and the star (0 order image) is not visible in the same frame. That is a setback, since having the star within the field of the image helps to callibrate spectral lines later on in the process.
In a later evening, I discovered that the grating could be screwed into the empty hole in the SBIG CFW-8 color filter wheel. This brings the grating closer to the chip and presents an image of the star (0 order) along with the 1st order spectrum all in the same field of an ST-7.
Use:
Taking images of spectra is a slight challenge, but much easier than taking long guided exposures of deep sky objects. In fact, the real bonus in imaging spectra is that you do not have to guide at all!
First, the object to be imaged is centered on the CCD chip, and the scope’s drive is kept running. Using slow motions, the star is moved to one side of the chip which brings the first order spectrum into view of the chip. Now you should be able to take a quick 2-3 second integration of the star and its first order spectrum. Some time must then be spent on focus. Be sure to focus on the spectrum, not the star, as the spectrum is created at a steep angle to the focal plane. Note that a sharp focus can only be achieved on one section of the spectrum at a time.
Once the star is focused, set the CCD software to take a ten second integration. Once set, turn off the mount’s tracking power letting the star drift in RA. Now, activate the integration. When complete, turn the drive back on again. This process can be repeated two to four times without having to re-center the star’s image on the chip.
Some Results:
The results will look something like this, a ten second integration of the star Regulus taken through a Takahashi FSQ-106n and using an SBIG ST-7. The reason for the slanted absorption lines is that the grating was not aligned perfectly with the RA drift angle. Just rotate the imager to achieve better results.

Also, keeping the grating aligned with the CCD’s pixel rows helps to keep things oriented better for these operations. I used some teflon tape on the filter threads to tighten the grating up in the proper orientation when I placed it into the CFW-8. Once aligned, the images will look more like the following:
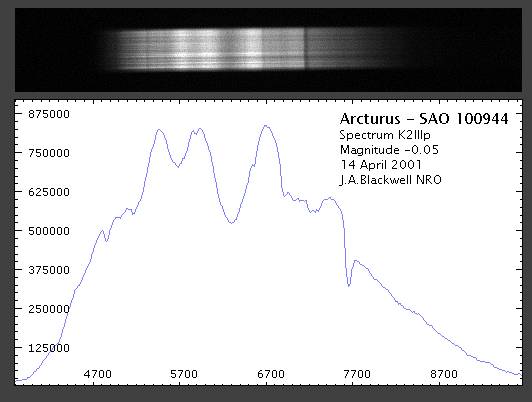
This is a 10 second integration of the star Arcturus, also using the FSQ-106n and the ST-7. The grating was properly aligned to the pixels, and the pixels were properly aligned to the RA drift direction. All went well here. Note the varying brightnesses of the horizontal lines. These are caused by scintillation, the star’s twinkling in the atmosphere. Even though the seeing conditions were not the best, a fine spectrum is captured. This makes for another reason to do spectroscopy 😉
Below is a chart of all the spectra I obtained on a couple of evenings. They are arranged such that their 0-order star image is in line from image to image, and they are all to the same scale (raw unprocessed FITS images converted to JPEG). They are also ordered such that the younger stars are at the top, and older stars are at the bottom. Note how the spectrum itself migrates towards the red and infra-red as the stars get older and redder. This is just as one would expect.

Callibration & Processing:
This is where one gets to play Sherlock Holmes. The real challenge in amateur spectroscopy is in the identification of spectral lines and other characteristics. I would recommend using the spectrum of type A stars like Vega or Sirius. These stars have prominent Hydrogen lines from the Balmer series. Identify these lines and their wavelengths in Angstroms, then measure the line distances from the 0-order star image in pixels, and you can derive the Angstroms per pixel resolution of your spectrograph. Just divide the Angstrom value of one of the prominent Hydrogen lines by the pixel distance it resides from the 0-order star image. Now use this value to make all future measurements given the same optical setup. This is not the most precise, but it is a good start.
Those looking for more precision should investigate the following two software packages, both free:
IRAF (UNIX flavors only)
VSpec (MS Windows, in French and English)
These will handle more complicated spectral analysis including the typical non-linear Angstrom-Pixel relationships you will discover. They will also help to identify various spectral lines.
When processing the spectrum, try to avoid complicated image processing algorythms that might alter the brightness levels of the image. Linear (screen) stretches are ok, but nonlinear ones complicate the analysis. Sometimes an unsharp mask helps to better define faint absorbtion lines. Both IRAF and VSpec will create graphs representing intensity vs. X-pixel-position (Wavelength).
Issues:
Simple spectrography like this has its limitations. The resolution is not near that of a professional instrument, but the cost is much more reasonable. Those looking around on the net will find better instruments for thousands of dollars, or may wish to build their own using commercially available gratings from places like Edmund Scientific.
This design can be greatly improved by adding a wedge prism to the grating. This “lenses” are available from Edmund Scientific and will help to reduce various abberations (coma). See a wonderful explanation online at Christian Buil’s website: The Theory of Diffractive Gratings in Converging Optical Beams. He goes into marvelous detail about the theory, construction and use of grisms for spectrography. This article is a “must” for those wishing to improve their systems.
Future Projects:
Some ideas for those interested in starting out with spectroscopy:
- Capture the spectra of each major spectral star type: OBAFGKM. Make a chart with the 0-order star images lined up and see how the star’s change from hot, blue and young to cold, old and red.
- Capture spectra from objects in our local stellar group and then of a quasar. See if you can detect the redshifted lines of Hydrogen.
- Check out the spectra of Wolf-Rayet, “Be” stars, and other interesting variables.
- Capture the spectra of small planetary nebulae. They should exhibit fine emmision spectra. Does your nebula filter work properly?
- A real challenge: see how many lines you can identify in a type M star.
Online Resources:
Here are some online resources that are very helpful:
Christian Buil’s Home Page
The Spectrography Bookmark
The Spectra of Gas Discharges
The Forum for Amateur Spectroscopy
A Grism Spectrograph:
Introduction:
First, an introduction. The reason I have written this is simply because I am getting many emails concerning how I have made a grism spectrograph and how it is used. I highly recommend that you also read Christian Buil’s marvelous website located at: http://astrosurf.org/buil/ I make no attempt to recreate his work here, but endeavor to show you how I made my grism and how it works for me.
What is a Grism?
A Grism is part diffraction grating and part wedge prism: Grating + Prism = Grism. It is really that easy, too.
My grating is a Rainbow Optics transmission grating available from Astrovid. It is a grating in between two pieces of glass in a standard 1.25″ filter housing. It has 200 lines per mm and is blazed for the first order to maximize efficiency. Efficiency seems to vary from one to another. Christian Buil’s site states that it is 67% efficient in the first order.
The wedge prism is from Edmund Scientific. It is part number H43651 for a 3.87 degree wedge prism that fits within the ring of the 1.25″ filter holder of the grating. You can get it with or without coatings.

Building Your Own:
Attaching the wedge prism (now “WP”) to the grating is tricky, important and tedious. Do it once and do it well. The goal is to align the WP such that the first order spectrum is brought back to the center of the optical axis. This reduces coma and allows the spectrum to come to a focus across its length on your CCD chip. The zero order star image will, of course, not be in focus when the spectrum is in focus. This is not an issue.
To align the two parts prior to gluing, I did the following: I made a PowerPoint slide that was black. On it, I made four white dots and a couple of white lines. The dots act like stars. The lines have to be parallel to each other, one above the other. Holding the grating up to this slide as it appears on a CRT will show the spectrum of your CRT! Note that you will see two spectra: one to each side of the bright dot. The brighter of the two is the first order spectra, and is the one you want to bring back to the center of the optical axis. So, for the sake of this paper, rotate the grating until the 1st order spectrum is to the right of the dot as you look at your CRT. Make sure the spectrum is aligned with the parallel lines you made on the slide. Now, grab the wedge prism. Be careful not to mark it with finger prints. Hold it in front of the grating. Rotate just the WP until the spectrum is brought back towards the zero order image. Hold it in place and mark the edges of the WP and the grating with a marker to establish alignment.

To attach one to the other I used hot melt glue. It works. It is not elegant. Apply it to the edge of the WP and to the cell of the grating. It can be removed easily and does not hurt anything. Three small dabs will do the job. It is important to have the WP on the telescope side of the grating. If you are placing your grism into a CFW-8 filter wheel, then the wedge prism must be glued onto the threaded side of the grating. NOTE this assembly will NOT fit into an SBIG CFW-10 filter wheel. The grism is just too thick.
Place this newly made grism assembly into your filter wheel or thread it into the nose of your CCD. I like to keep the grating aligned such that the spectrum runs north to south. That way any periodic error will not harm the spectrum image but will just spread it out.

Using the Grism:
Since this is a transmission grating, you can see stars to guide on! It works well, but remember to focus on the spectrum and not the stars. This is best done by finding a star with prominent lines and focusing on them.
Armed with this system, you have the ability to take a full-field of spectra of multiple objects. You are limited only by the size of your CCD chip and the telescope you use. For my ST-7 on an FSQ-106n (106mm f/5) refractor, I get about 17 Angstroms per pixel. This is good enough to show the hydrogen Balmer series and a whole host of other features in point source spectra. Here are two examples:
This first spectra is of Gamma Gem, a type A0iv star which is used as a spectral standard. You can see the obvious H-Balmer absorption series in this.

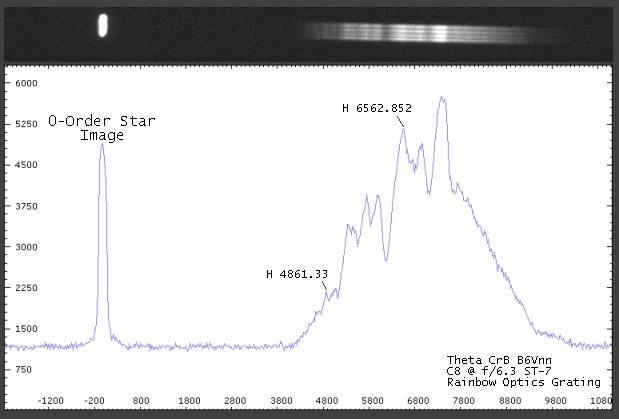
This second image is of the variable star Theta CrB, a hot class B dwarf with a very fast rotational period of about 10 hours! It has an excited gas shell causing emission lines and is labeled a Be (B-Emission) star. Note that I have left the 0-order image of the star itself for you to see here. Having the 0-order image helps in several ways: Identification of fainter objects is made easier. If you know the typical angstrom/pixel value of your system, wavelength calibration is much easier when studying unknown objects.